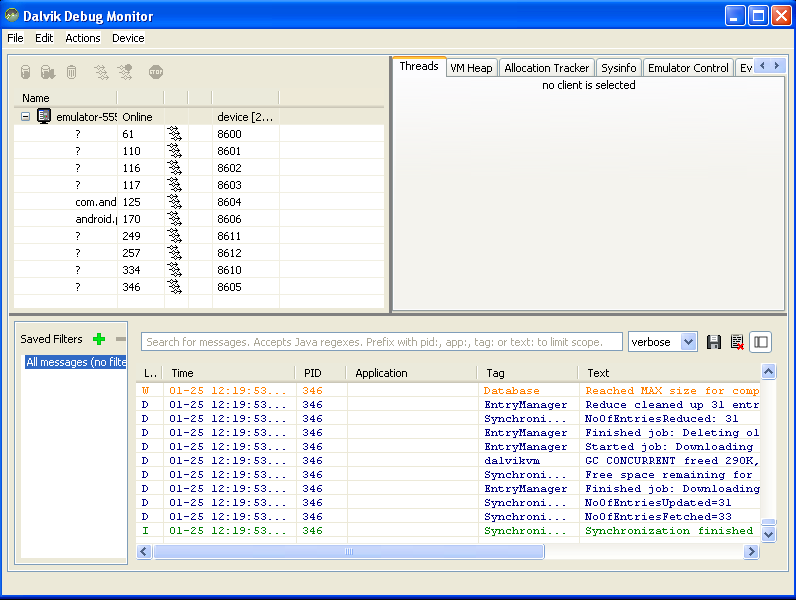
DDMS provides Threads, VMHeap, Allocation Tracker, Emulator control and other tabs to monitor application performance. The following sections describe how to use DDMS and the various tabs and panes that are part of the DDMS GUI
Examining thread information
The Threads tab in DDMS shows you the currently running threads for a selected process.
Select the process that you want to examine the threads for.
Click the Update Threads button.
In the Threads tab, you can view the thread information for the selected process.
“main” (see name column) thread is your applications process
Click on refresh button to view class and method information.
If Native = false, method/class is from application, else method/class is from Android OS.
Heap and non-Heap memory
The device JVM memory consists of the following segments:
Heap Memory, which is the storage for Java objects
Non-Heap Memory, which is used by Java to store loaded classes and other meta-data
JVM code itself, JVM internal structures, loaded profiler agent code and data, etc.
Viewing heap usage for a process
DDMS allows you to view how much heap memory process is using. This information is useful in tracking heap usage at a certain point of time during the execution of your application.
The Dalvik virtual machine can produce a complete dump of the contents of the virtual heap. This is very useful for debugging memory usage and looking for memory leaks.
To view heap usage for a process:
Select the process that you want to see the heap information for.
Click the Show Heap Updates button to enable heap information for the process.
In the VM Heap tab, click Cause GC to invoke garbage collection, which enables the collection of heap data. When the operation completes, you will see a group of object types and the memory that has been allocated for each type. You can click Cause GC again to refresh the data.
Click on an object type in the list to see a bar graph that shows the number of objects allocated for a particular memory size in bytes.
There are many types of objects that are identified by DVM which are categorized as below.
Class Objects are instances of Class, e.g. what you'd get from java.lang.String.class or myObject.getClass().
The arrays are binned by size. For example, 2-byte arrays could be short[] or char[]. 4-byte arrays include float[], int[], and all Object[].
A non-Java Object is a piece of memory that isn't actually accessible from code written in Java. Essentially it's a blob of stuff that got stuck on the virtual heap but has no meaning to interpreted code. Shouldn't be much of that.
Data Objects are objects that don't fall into one of the special categories. ArrayList, HashMap, whatever.
Allocation Tracker
In a performance-sensitive code path, such as the layout or drawing method of a view or the logic code of a game, any allocation comes at a price. After too many allocations, the garbage collector will kick in and stop your application to let it free some memory. Most of the time, garbage collections happen fast enough for you not to notice. However, if a collection happens while you are scrolling through a list of items or while you are trying to defeat a foe in a game, you may suddenly see a drop in performance/responsiveness of the application. It's not unusual for a garbage collection to take 100 to 200 ms. For comparison, a smooth animation needs to draw each frame in 16 to 33 ms. If the animation is suddenly interrupted for 10 frames, you can be certain that your users will notice.
Most of the time, garbage collection occurs because of tons of small, short-lived objects and some garbage collectors, like generational garbage collectors, can optimize the collection of these objects so that the application does not get interrupted too often. The Android garbage collector is unfortunately not able to perform such optimizations and the creation of short-lived objects in performance critical code paths is thus very costly for your application.
To help you avoid frequent garbage collections, the Android SDK ships with a very useful tool called allocation tracker. This tool is part of DDMS, which you must have already used for debugging purposes. To start using the allocation tracker, you must first launch the standalone version of DDMS, which can be found in the tools/ directory of the SDK. The version of DDMS included in the Eclipse plugin does not offer you ability to use the allocation tracker yet. Once DDMS is running, simply select your application process and then click the Allocation Tracker tab. In the new view, click Start Tracking and then use your application to make it execute the code paths you want to analyze. When you are ready, click Get Allocations. A list of allocated objects will be shown in the first table. By clicking on a line you can see, in the second table, the stack trace that led to the allocation. Not only you will know what type of object was allocated, but also in which thread, in which class, in which file and at which line.
File System
DDMS provides a File Explorer tab that allows you to view, copy, and delete files on the device. You can view this tab by going to the ‘Device’ menu and clicking on the ‘File Explorer’ tab. Using this feature the user can examine files that are created by your application or if you want to transfer files to and from the emulator/device to the local machine.
To work with an emulator or device's file system:
In the File explorer tab, select the file that you want ot view.
To copy a file from the device/emulator, locate the file in the File Explorer and click the Pull file button.
To copy a file to the device/emulator, click the Push file button on the File Explorer tab.
This topic explains the usage of DDMS tool provided by android SDK for debugging an android application and monitoring it.
Android – DDMS (Dalvik Debug Monitor Server)
Android SDK ships with a debugging tool called the Dalvik Debug Monitor Server (DDMS), which provides:
port-forwarding services
screen capture on the device
thread and heap information on the device
logcat
process
radio state information
incoming call and SMS spoofing
location data spoofing
Run DDMS
To run DDMS we need to execute the bat file that is present in the tools folder of the Android SDK.
Or, From the command line: type ddms (or ./ddms on Mac/Linux) from the tools/ directory.
Note: You need to set the tools folder path to ‘PATH’ environment variable.
The left pane displays all the application processes which are running on the device. Apart from that we can also get to know the process id as well the port on which the process is running. Selecting a particular process will allow us to monitor the application using the features which are present on the right side of the window.
How DDMS Interacts with a Debugger
On Android, every application runs in its own process, each of which runs in its own virtual machine (DVM). Each VM exposes a unique port that a debugger can attach to.
When DDMS starts, it connects to adb.
Android Debug Bridge (ADB)
adb is a versatile tool lets you manage the state of an emulator instance or Android-powered device.
Monkey Test : Testing Application on Android devices :
The monkey tool runs in an adb shell directly on the device or emulator and generates pseudo-random streams of user and system events. In comparison, the monkey runner tool controls devices and emulators from a workstation by sending specific commands and events from an API.
The monkey runner tool provides these unique features for Android testing:
* Functional testing: monkey runner can run an automated start-to-finish test of an Android application. You provide input values with keystrokes or touch events, and view the results as screenshots.
* Regression testing - monkey runner can test application stability by running an application and comparing its output screenshots to a set of screenshots that are known to be correct.
UI/Application Exerciser Monkey:
The Monkey is a program that runs on your emulator or device and generates pseudo-random streams of user events such as clicks, touches, or gestures, as well as a number of system-level events. You can use the Monkey to stress-test applications that you are developing, in a random yet repeatable manner.
Basic Use of the Monkey
You can launch the Monkey using a command line on your development machine or from a script. Because the Monkey runs in the emulator/device environment, you must launch it from a shell in that environment. You can do this by prefacing adb shell to each command, or by entering the shell and entering Monkey commands directly.
The basic syntax is: adb shell monkey [options]
With no options specified, the Monkey will launch in a quiet (non-verbose) mode, and will send events to any (and all) packages installed on your target. Here is a more typical command line, which will launch your application and send 50000 pseudo-random events to it:
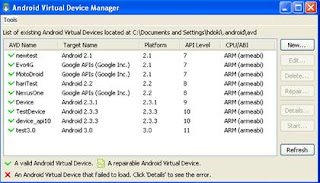
1. Creating Android Virtual Devices (AVD) to provide different conditions and configurations for the application 2. Understanding the different configurations we can specify while creating AVDs 3. How to run AVDsCreating Android Virtual Devices
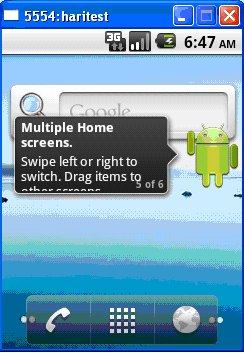
An Android Virtual Device (AVD) is an emulator that simulates a real-world Android device, such as a mobile phone or Tablet PC. One can use AVDs to test how an application performs on a wide variety of Android devices, without having the gadget.
One can create as many AVDs as they like, each set up with different versions of the Android Platform. For each AVD created, one can configure various hardware properties such as whether it has a physical keyboard, GPS support, the camera resolution etc.
However, it is ideal to run final tests on real devices for various reasons.
1. To start AVD, one needs to install Android SDK Install Android SDK for windows: http://developer.android.com/sdk/index.html 2. To navigate to AVD, C :\< android-sdk-windows> -> Click on AVD manager
Refer managing AVDs with AVD Manager: http://developer.android.com/guide/developing/devices/managing-avds.html Market statistics based on screen sizes: http://developer.android.com/resources/dashboard/screens.html
Click on New button, to create a new AVD
An AVD configuration describes how the emulator should emulate a real device, including:
What version of the Android platform to emulate (API Level)
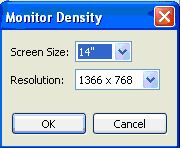
The screens sizes can vary from QVGA (240×320), WVGA (480×800), HVGA (320×480), FWVGA (480×854) , in tablets you will find 1024×600 and what probably will be the standard for tablets 1280×800.So running the same application on 240×320 screens and in the same time on 1280×800 screens is huge challenge.
Android OS versions – The android platform is changing very fast. The difference from version 1.5 to version 2.3 is huge. Lots of new capabilities like graphics HW acceleration were added and can affect your application.
CPU – Mobile devices in general are very sensitive to processing power. We can see phones with single core running at 600 MHz to phones that have duel core 1200 MHz.
Select the following options, if you wish: Name: motodroid Target: Google APIs - API level 10 SD Card Size: 50MiB Skin: Default (WVGA800)
Emulator Keyboard shortcuts: http://developer.android.com/guide/developing/tools/emulator.html List of Android devices: http://en.wikipedia.org/wiki/List_of_Android_devices
Sample AVD configurations listed below:
How to create AVD configurations for popular android devices:
HTC Evo
HTC Evo:
The important specs of this device from an Emulator perspective are:
Target platform: Currently Android 2.1
Screen info: Large screen, high density
Lack of keyboard and DPad
Lack of trackball
Therefore, let’s create an AVD configuration called Evo4G:
Click the “New” button to create a new AVD configuration
Name the AVD: “Evo4G”
Select the Target: “Google APIs API Level 7”
Input the SD Card Size: “8GB”
Input the Skin Details: “800×480”
Edit the Hardware Property for Abstracted LCD Density: “217”
Add another Hardware Property for DPad Support: “No”
Add another Hardware Property for Keyboard Support: “No”
Add another Hardware Property for Track-ball Support: “No”