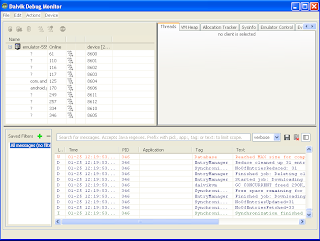
This topic explains the usage of DDMS tool provided by android SDK for debugging an android application and monitoring it.
Android – DDMS (Dalvik Debug Monitor Server)
Android SDK ships with a debugging tool called the Dalvik Debug Monitor Server (DDMS), which provides:- port-forwarding services
- screen capture on the device
- thread and heap information on the device
- logcat
- process
- radio state information
- incoming call and SMS spoofing
- location data spoofing
Run DDMS
To run DDMS we need to execute the bat file that is present in the tools folder of the Android SDK.
Or, From the command line: type ddms (or ./ddms on Mac/Linux) from the tools/ directory.
Note: You need to set the tools folder path to ‘PATH’ environment variable.

The left pane displays all the application processes which are running on the device. Apart from that we can also get to know the process id as well the port on which the process is running. Selecting a particular process will allow us to monitor the application using the features which are present on the right side of the window.
How DDMS Interacts with a Debugger
On Android, every application runs in its own process, each of which runs in its own virtual machine (DVM). Each VM exposes a unique port that a debugger can attach to.
When DDMS starts, it connects to adb.
Android Debug Bridge (ADB)
adb is a versatile tool lets you manage the state of an emulator instance or Android-powered device.
- Manage the state of an emulator or device
- Run shell commands on a device
- Manage port forwarding on an emulator or device
- Copy files to/from an emulator or device
No comments:
Post a Comment